|
|
|
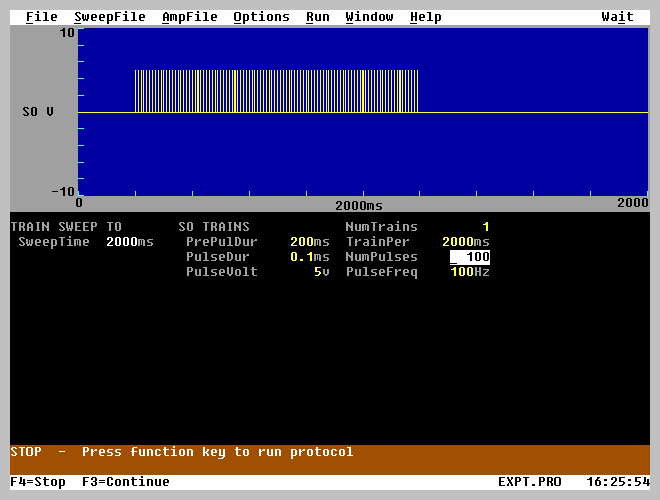
Fig 3.1.1. TrainSweep T0 Stimulation Window |
Chapter 3 - ORGANIZATION OF THE LTP PROGRAM
The LTP program is organized as multiple pages or windows, one of which can be viewed at one time. You can choose a different neighboring window by pressing the PgUp/PgDn keys, or windows can be chosen by using the Windows menu (see Fig. 3.4.6A,B). The windows are:
| 1. | TrainSweep T0 Stimulation Window (Fig. 3.1.1), for setting TrainSweep T0 stimulation parameters. | |
| 2. | TrainSweep T1 Stimulation Window, for setting TrainSweep T1 stimulation parameters (not shown). (This window will only appear if Two Sweep or Alternating Two Sweep Stimulation Basic Protocol is chosen.) | |
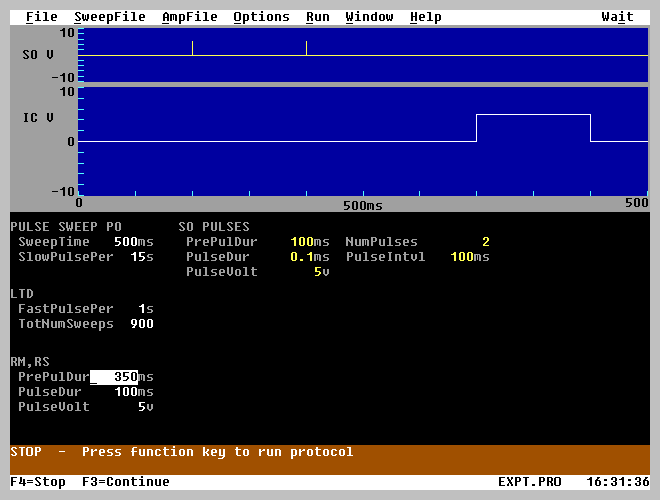
| 3. | PulseSweep P0 Stimulation Window (Fig. 3.1.2), for setting PulseSweep P0 stimulation parameters. | |
| 4. | PulseSweep P1 Stimulation Window for setting PulseSweep P1 stimulation parameters (not shown). (This window will only appear if Two Sweep or Alternating Two Sweep Stimulation Basic Protocol is chosen.) | |
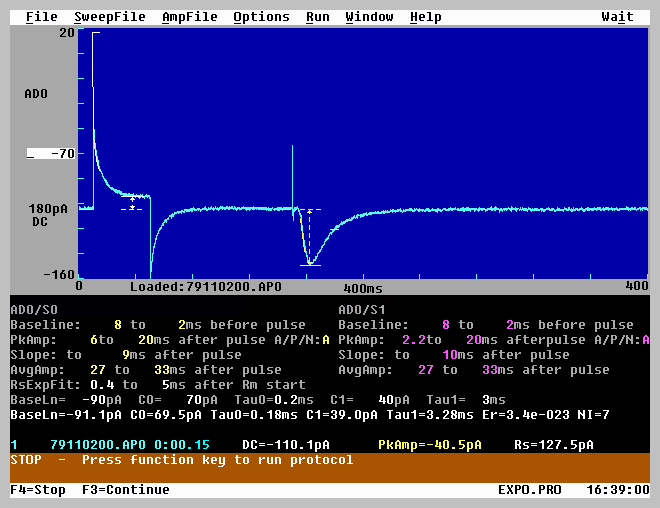
| 5. | Pulse or Train Waveform Detection Window (Fig. 3.1.3), for setting parameters for detecting waveform DC Baseline, Peak Amplitude, Peak Latency, Area, Duration, Coastline, Rise Time, Decay Time, PopSpike Amplitude, PopSpike Latency, Slope, Average Amplitude, Cell Resistance (Rm), and patch electrode series resistance (Rs). In the Pulse ADsweep graph, lines for these calculations will be drawn when appropriate. | |
| 6. | Main Page Window (Fig. 3.1.4), for simultaneous viewing of an Pulse or Train ADsweep graph (bottom graph), and possibly one calculation graph for a waveform detection value such as Peak Amplitude, Slope, etc (top graph). Whether a calculation graph appears depends upon whether one was chosen for the ViewPage - see the ‘Calculations To Do’ dialog boxes in Fig. 4.6.1 and 4.6.2 in Section 4.6. | |
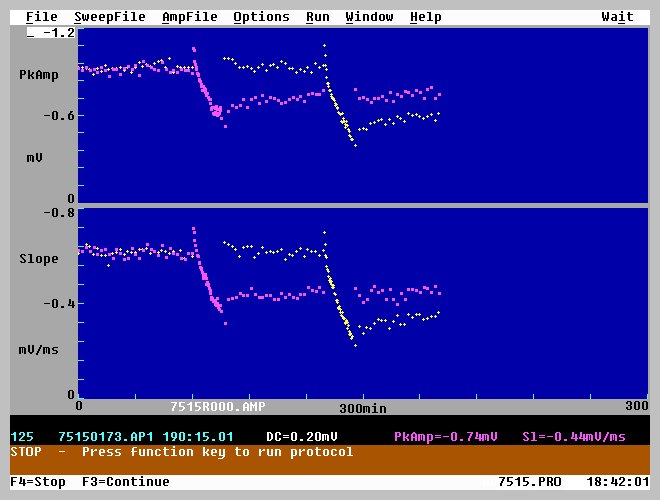
| 7. | CalculationPage0 Window (Fig. 3.1.5), an optional calculation page for showing one, two or three calculation graphs of Peak Amplitude, Slope, etc. Whether calculation graph appear on the calculation page, and if there actually is a calculation page, again depends upon what was chosen in the ‘Calculations To Do’ dialog box. | |
| 8. | CalculationPage1 Window (not shown), a second optional calculation page for showing more of the one, two or three calculation graphs of Peak Amplitude, Slope, etc. | |
| 9. | Miscellaneous Values Window (Fig. 3.1.6), for setting various program values including Data Acquisition Parameters (TrainSweep AD sample interval, PulseSweep AD sample interval, channel AD0 gain, and channel AD0 data type), whether to automatically save TrainSweep data to disk, whether to automatically save PulseSweep data to disk and/or printer, and whether to automatically save Amplitude/Slope calculations data to disk. |
|
|
|
Fig 3.1.1. TrainSweep T0 Stimulation Window |
|
|
| Fig 3.1.2. PulseSweep P0 Stimulation Window |
|
|
| Fig 3.1.3. Pulse or Train Waveform Detection Window |
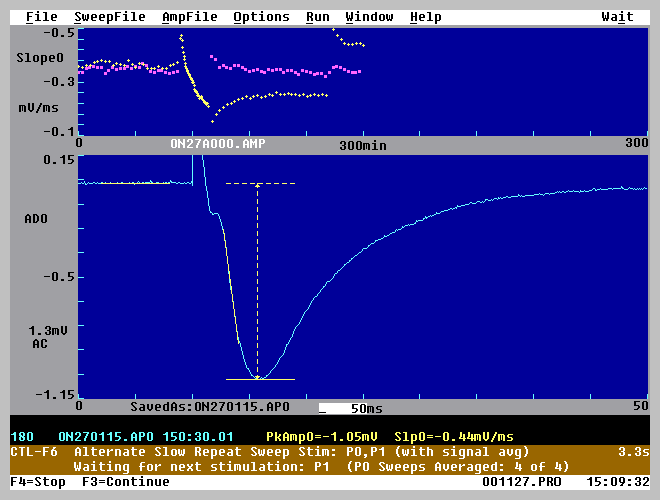 |
| Fig. 3.1.4. The Main Page Window of the program showing one Calculation graph (Slope, top) and one Pulse ADsweep graph. The calculation line also shows DC Baseline, Peak Amplitude and Slope numeric values. (Data courtesy of Zuner Bortolotto and Graham Collingridge.) |
|
|
| Fig. 3.1.5. Calculation Page0 Window showing Peak Amplitude and Slope calculation graphs for an extracellular experiment having S0 (+) then S1 (¦ ) 1 Hz LTD sweep stimulation. (Data courtesy of Nicola Kemp and Zafar Bashir.) |
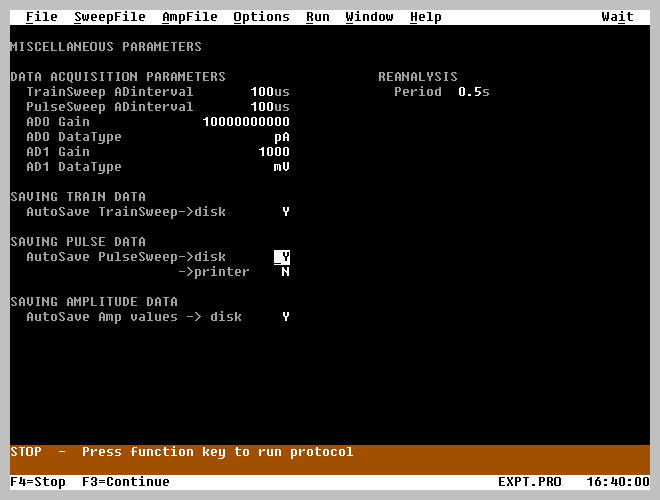 |
| Fig. 3.1.6. Miscellaneous Values Window |
At the bottom of every page are 5 lines (see the bottom 5 lines on Fig. 3.1.4) containing:
| 1. | The Message Line - Green means successful operation message, Yellow means warning message, Red means error message. | |
| 2. | The Calculation Line (which is printed only during analysis) and contains: |
| a. | the Calculation Number | ||
| b. | the ADsweep data file it is in | ||
| c. | the Time on the Calculation graph the data point was taken (in Min:Sec.UpToTenthsOfMsec) | ||
| d. | One, two or three Calculation Values which can include (for channel AD0): DC Baseline "DC0=...", Peak Amplitude "PkAmp0=...", Peak Latency "PkLat0=...", Area "Area0=…", Duration "Du0r=…", 10-90% Rise Time "RiseTm0=…", 10-90% Decay Time "DecTm0=…", Coastline "CoastLn0=…", PopSpike Amplitude "PSamp0=…", PopSpike Latency "PSlat0=…", Slope "Slp0=...", Average Amplitude "AvAmp0=...", Membrane Resistance "Rm0=...", Patch Electrode Series Resistance "Rs0=...". For channel AD1 substitute 1 for 0. Whether a Calculation Value appears depends upon whether one was chosen for the CalcLine - see the ‘Calculations To Do’ dialog boxes in Fig. 4.6.1 and 4.6.2 in Section 4.6. |
| 3,4. | Two Run Lines showing: |
| a. | either "STOP - ..." or else a Protocol that is running. |
| If the protocol is a repeating protocol, the Repeating Protocol that is running (such as "CTL-F6 - Repeat Single Pulse Stimulation") is on the top line and the momentary protocol (such as "Waiting for next stimulation" or "Single Pulse Stimulation") is on the bottom Run Line. |
| b. | The Time Until Next Sweep (in Sec.TenthOfSecs) is on the right side of the upper Run Line. |
| 5. | The Status Line showing either: |
| a. | some of the Function Keys that can be used to alter a Protocol (usually F4=Stop and F3=Continue), the Protocol File Name (*.pro) and the Time of Day (Hrs:Min:Sec) |
| or |
| b. | other information such as what keys to press while in a Dialog Box. |
Each Window contains graphs and fields.
| Graphs are for: |
| 1. | Showing Analog and Digital Output pulse stimulation (e.g. Fig 3.1.2). | |
| 2. | Showing AD waveforms with superimposed Amplitude/Slope calculation lines (e.g. Fig. 3.1.3). | |
| 3. | Showing calculations of DC Baseline, Peak Amplitude, Peak Latency, Area, Duration, Rise Time, Decay Time, Coastline, PopSpike Amplitude, PopSpike Latency, Slope, Average Amplitude, Cell Resistance (Rm), and patch electrode Series Resistance (Rs) (e.g. Fig. 3.1.5). |
Fields are located both on graphs (to directly change graph X and Y axis values) and on the rest of the screen (to change various program parameters). You can move from field to field by pressing the Left, Right, Up and Down Arrow keys.
It is important to briefly discuss on how the AC/DC field in the ADsweep graphs operates (see Fig. 3.1.3). When the field is AC, the waveform is not high pass filtered, but the first 10th of the waveform is displayed at 0 mV or 0 pA. This produces an ersatz 'AC coupling' of the waveform, and allows small signals with large slow voltage fluctuations to be displayed in the graph, but the waveform is not at all distorted by high pass filtering and is plotted DC ('Direct Coupled') except for the superimposed offset. When the field is DC, no offsets imposed on the display of the waveform. The AC/DC field only affects the display of the data and does not affect the data values saved in the ADsweep (*.T0, *.T1, *.P0, *.P1, *.AP0 or *.AP1) files, which are saved as DC values.
Menus and dialog boxes are used to set program parameters that should not normally need to be changed during a Protocol run. It is important to understand that when an Menu or Dialog Box is shown, the generation and plotting of ADsweeps is suspended (only the Time-of-Day clock runs) until the Menu or Dialog Box is removed from the screen.
The Menus and Dialog Boxes are used as in Microsoft Windows. The main difference is that in the LTP program Menu and Dialog Box functions are chosen using keyboard input (using TAB/SHIFT-TAB and UpArrow/DownArrow keys), whereas in Microsoft Windows they are chosen using simultaneous mouse and/or keyboard input. The keyboard use in LTP is usually identical to keyboard use in standard Windows programs. (In Windows, there is a keyboard equivalent to every mouse function).
| LTP Program | Windows | |||||
| To use the Menu system: | ||||||
| Pulldown a menu from the Menu Bar | Press Alt key and then underlined letter as in Alt-F for File | same | ||||
| Choose a pulldown menu selection | Move UpArrow or DownArrow | same | ||||
| or | ||||||
| Press Alt then underlined letter (Alt-X) | same | |||||
| or | ||||||
| just underlined letter as in 'x' for Exit | same | |||||
| To use the Dialog Boxes: | ||||||
|
Press Tab or Shift-Tab (to move in the reverse direction) | same | ||||
|
Move UpArrow or DownArrow | same | ||||
| To change whether a Check Box is On or Off | Press SpaceBar | same |
|
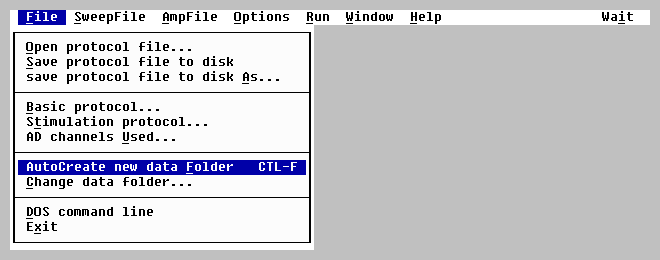
The LTP24 program uses the following Menus: |
| 1. | Protocol File Menu (Fig. 3.4.1) | |
| 2. | SweepFile Menu for loading, saving and printing individual ADsweep files (Fig. 3.4.2) | |
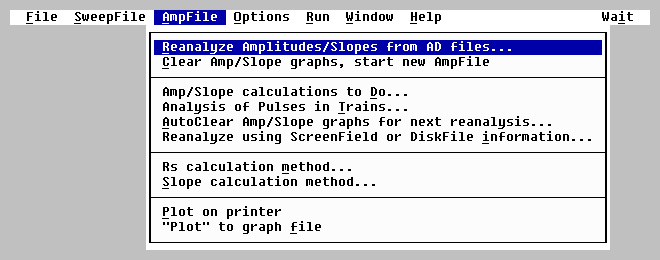
| 3. | Amplitude or AmpFile Menu for performing synaptic response analysis and reanalysis (Fig. 3.4.3) | |
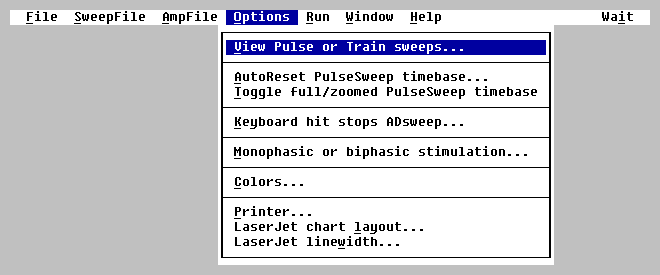
| 4. | Options Menu (Fig. 3.4.4) | |
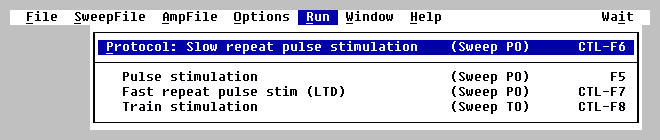
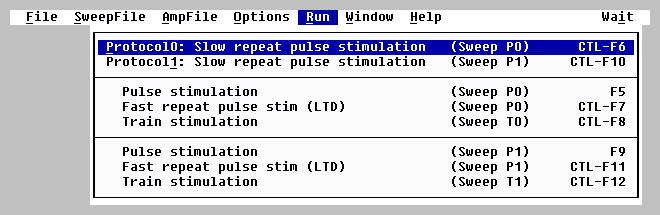
| 5. | Run Menu - an alternative to running protocols by pushing function keys (Fig. 3.4.5A,B,C) | |
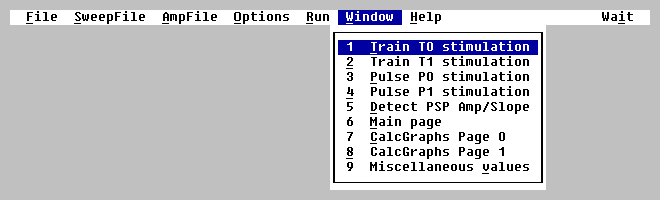
| 6. | Window Menu - an alternative to using PgUp and PgDn keys (Fig. 3.4.6A,B) | |
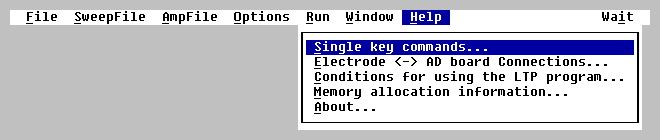
| 7. | Help Menu (Fig. 3.4.7) |
Menus in the LTP Program
|
|
|
Fig. 3.4.1. Protocol File Menu |
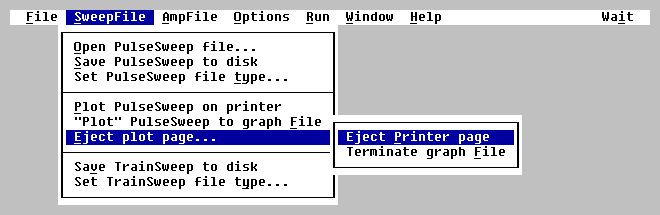 |
| Fig. 3.4.2. SweepFile Menu (including Eject plot page Menu). |
 |
|
Fig. 3.4.3. Amplitude File Menu. |
 |
|
Fig. 3.4.4. Options Menu. |
 |
|
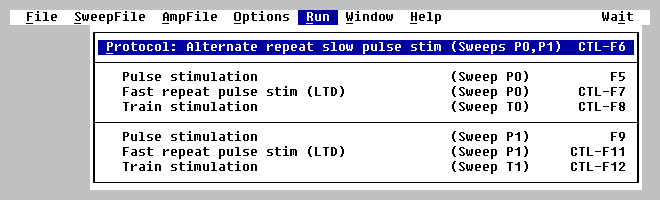
Fig. 3.4.5A. Run Menu (with Basic Protocol - One Sweep (P0) Stimulation chosen). |
 |
|
Fig. 3.4.5B. Run Menu (with Basic Protocol - Two Sweep Stimulation chosen). |
 |
|
Fig. 3.4.5C. Run Menu (with Basic Protocol - Alternating Two Sweep Stimulation). |
 |
|
Fig. 3.4.6A. Window Menu (with Basic Protocol - P0 Sweep Stimulation and Train T0 stimulation, and no Calc pages). |
 |
|
Fig. 3.4.6B. Window Menu (with Basic Protocol - Alternating P0 and P1 Sweep and Train T0 and T1 stimulation chosen, plus two Calc pages). |
 |
|
Fig. 3.4.7. Help Menu. |
3.5 Running Protocols using Function Keys and Menus
Protocols can be started by either pressing a Function Key, or by choosing the correct line in the Run menu (Fig. 3.4.5A,B,C). The Run menu gives a description of the protocol on the left side of the line, and the shortcut Function Key that can be alternatively pressed to start that protocol.
Which Protocols can be run and therefore which Function Keys / Run Menu choices depends on the choices made in the Basic Protocol (see Fig. 4.2.1). For example, if One Sweep Stimulation (P0) in the Basic Protocol is chosen, the choices shown in the Run Menu shown in Fig. 3.4.5A can be used. Pressing CTL-F6 or choosing that Run Menu line will start the Slow Repeat Sweep P0 Stimulation protocol. Pressing F5 or choosing that Run Menu line will produce a Single Sweep P0 Stimulation. Pressing CTL-F7 or choosing that Run Menu line will start a Fast Repeat Sweep P0 Stimulation protocol that is used to produce Long-Term Depression (LTD) or depotentiation. Pressing CTL-F8 or choosing that Run Menu line will produce a Train Sweep T0 Stimulation.
Secondly, if Two Sweep Stimulation (P0 or P1) in the Basic Protocol is chosen, the choices shown in the Run Menu shown in Fig. 3.4.5B can be used. In addition to the One Sweep Stimulation choices described above, pressing CTL-F10 or choosing that Run Menu line will start the Slow Repeat Sweep P1 Stimulation protocol. Pressing F9 or choosing that Run Menu line will produce a Single Sweep P1 Stimulation. Pressing CTL-F11 or choosing that Run Menu line will start a Fast Repeat Sweep P1 Stimulation protocol to produce LTD. Pressing CTL-F12 or choosing that Run Menu line will produce a Train Sweep T1 Stimulation.
Finally, if Alternating Two Sweep Stimulation (P0 and P1) in the Basic Protocol is chosen, the choices shown in the Run Menu shown in Fig. 3.4.5C can be used. In addition to the One and Two Sweep Stimulations choices described above, pressing CTL-F6 or choosing that Run Menu line will now start the Alternate Repeat Slow Sweep P0,P1 Stimulation protocol, where first Sweep P0 stimulation is generated, and then the second Sweep P1 stimulation is generated. Pressing CTL-F10 now has no effect.
3.6 Coding of Synaptic Waveform Detection
Different colors are chosen in the program depending on whether a synaptic potential was stimulated by S0 or S1 stimulation.
Yellow denotes extracellular electrode S0 stimulation in the Train and Pulse Sweep Stimulation Windows. Yellow marks the superimposed DC Baseline, Peak Amplitude, Slope etc superimposed calculation lines for the first S0 stimulation in the Pulse ADsweep graphs in the Pulse Detection Window (Fig 3.1.3) and MainPage Window (Fig 3.1.4). Yellow also denotes the S0 DC Baseline, Peak Amplitude, Slope etc. calculations in the points plotted in the Amplitude/Calculation graphs, and on the Calculation Line (Fig 3.1.5).
Magenta denotes extracellular electrode S1 stimulation in in the Stimulation Windows, Detection Window, ADsweep graphs, Calculation graphs and Calculation Line.
White denotes intracellular electrode stimulation for measurements of cell resistance (Rm) and patch electrode series resistance (Rs) in the Stimulation Windows, Detection Window, ADsweep graphs, Calculation graphs and Calculation Line.