|
LTP version 1.13E
|
|
ADDITIONS TO THE 'LTP' DATA ACQUISITION PROGRAM W.W.Anderson and G.L.Collingridge MRC Centre for Synaptic Plasticity and Dept. of Anatomy, Univ. of Bristol, Bristol, UK |
|
Introduction |
|
LTP version 1.01M The original 'LTP' program (version 1.01M, Anderson and Collingridge, Neurosci. Abst 23:665, 1997) recorded synaptic activity in extracellular, current clamp or voltage clamp modes. It produced repetitive sweeps with simultaneous data acquisition (over 1,000,000 samples/sweep), extracellular S0 and/or S1 pathway stimulation, and intracellular epoch-like analog stimulation. Version 1.01M basic protocols included slow alternate dual pathway S0/S1 stimulation (Fig 1). LTP could be induced by single train, repetitive train, or primed burst stimulation. LTD induction and analysis was performed using fast repetitive sweeps (up to 2 Hz). On-line analyses included: DC baseline, peak amplitude, slope, average amplitude, cell resistance and patch electrode series resistance. However, only the first S0 pulse (of sweep P0) and/or the first S1 pulse (of sweep P1) could be analyzed.
|
|
LTP version 1.13E
|
|
LTP version 2
Trains can now be specially analyzed by using a) baselines and responses of all pulses (not shown), b) baseline of the first pulse and responses of all pulses (Fig 5), c) baseline and response of the first pulse only (Fig 6), or d) baseline of the first pulse and response of the last pulse (Fig 7). Sweeps can now be signal averaged and digitally filtered both on- and off-line. |
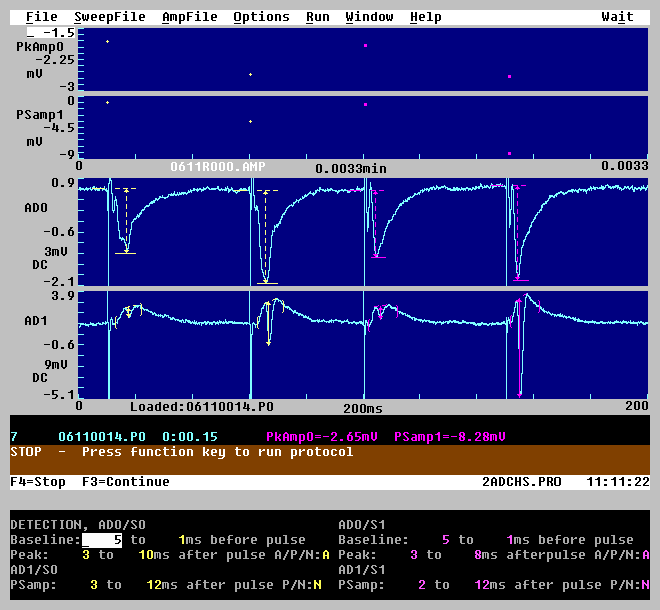
Fig 3. ‘LTP’ program version 2.2 records two AD channels, and analyses all S0- and S1-evoked EPSPs on both AD channels. The third and fourth panels show channel AD0 (recording synaptic responses from the CA1 dendritic layer), and channel AD1 (recording population spikes from the CA1 cell body layer). Paired S0-evoked synaptic responses are shown in yellow, paired S1-evoked synaptic responses are shown in magenta. The top two panels show calculated values for the peak amplitude of the synaptic responses in AD0 (PkAmp0), and the pop-spike amplitude from the responses in AD1 (PSamp1). The bottom panel shows the detection fields for determining baseline and peak amplitude of AD0 (for S0 and S1), and pop-spike amplitude of AD1 (for S0 and S1) detection. (Data courtesy of Steve Fitzjohn and Graham Collingridge.) |
Fig 4. Amplitude events list from the analysis of the sweep in Fig 3. The "Time sec" field shows the time of the stimulus pulse from when analysis starts (in this case simply the beginning of this sweep). Channel AD0 is calculated first, S0-evoked EPSPs are calculated first, and Pulse Number is calculated sequentially. When the PkAmp values (for AD1) or the PSamp values (for AD0) are not calculated, they are set to 0. |
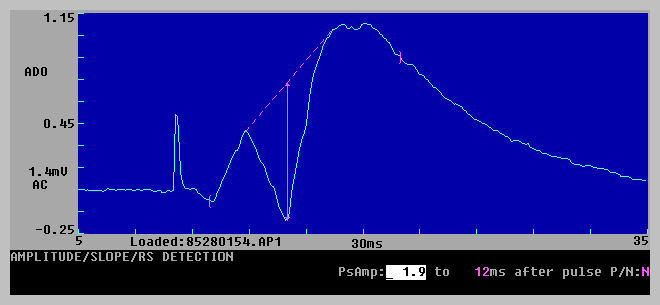
Fig 5. Analysis of each mossy fiber-CA3 extracellular EPSP in a 100 pulse train using the baseline of the first pulse and the responses for all the pulses. Stimulus artifacts have been automatically removed. b) Channel AD0 time sweep magnification showing the first 9 (top panel) and last 9 EPSPs of the train (bottom panel). The gray traces show the waveform with stimulus artifacts present, the light blue traces show the waveform with the stimulus artifacts removed. Calculation of peak amplitude from the stimulus artifact-free waveform allows amplitude measurement that is not contaminated by stimulus artifacts occurring near the peak. c) Channel AD0 amplitude and time sweep magnification showing the third EPSP of the train. Top trace: Blanking only 0.4 ms of the stimulus artifact causes incomplete removal of the stimulus artifact. Middle trace: Optimum 0.7 ms blanking of the stimulus artifact. Bottom trace: Slightly excessive 1 ms blanking of the stimulus artifact does not cause problems in measuring peak amplitude. (Data courtesy of Zuner Bortolotto and Graham Collingridge.) |
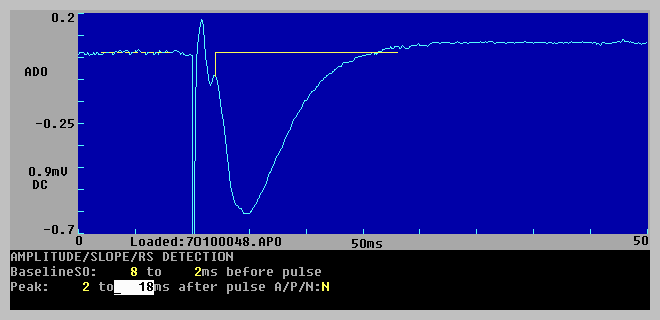
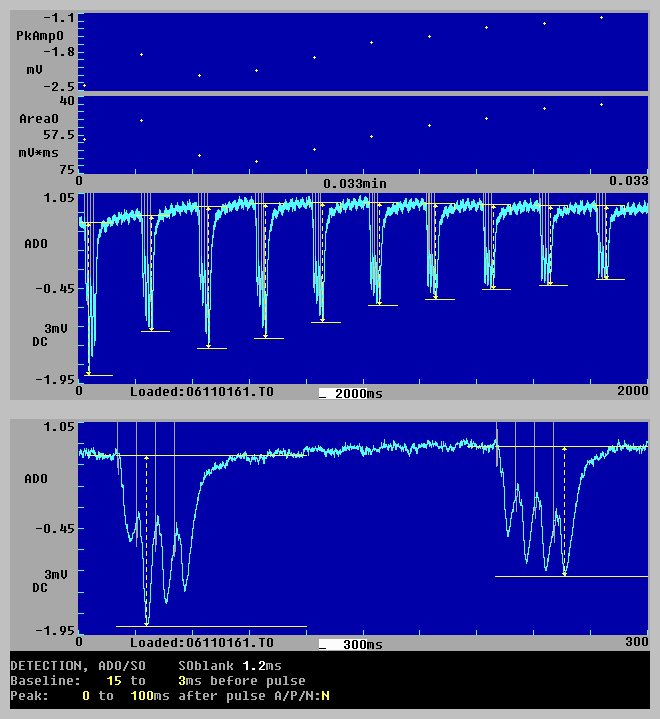
Fig 6. Analysis of repetitive train (theta burst) evoked extracellular CA1 EPSPS using the baseline and response of only the first pulse in the train. With cursors set at sufficiently long duration, the peak amplitude of the largest EPSP in the train, and the area of the entire synaptic response can be determined. Accurate calculation of area cannot be made without removing the stimulus artifacts. Top two panels: Calculated peak amplitude (PkAmp0) and area (Area0) values for each train. Third panel: Recording of the entire 10 train sweep in channel AD0. Fourth panel: Channel AD0 time sweep magnification showing the first two trains of the sweep. In the first train the second EPSP is the largest, and in the second train the last EPSP is the largest. (Data courtesy of Steve Fitzjohn and Graham Collingridge.) |
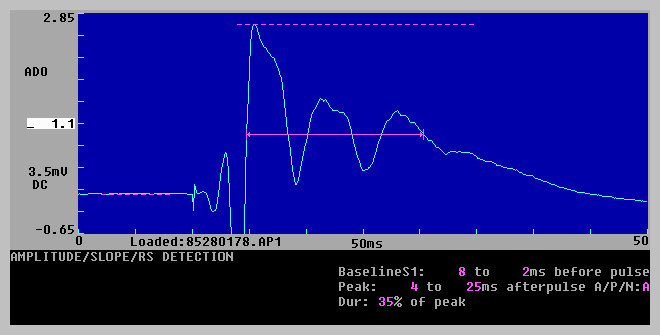
Fig 7. Analysing trains using the baseline of the first pulse and response of the last pulse. This measures the response at the end of the train regardless of the length of the train. In the second S0-evoked train (yellow), only the last EPSP is analyzed. In addition to measuring the last pulse of a train, this is useful for measuring responses that only occur after the train has ended (such as post-inhibitory rebound). (Data courtesy of Steve Fitzjohn and Graham Collingridge.) |
|
Future Enhancements
|