- View sweeps by clicking on an Analysis
Graph data point - Impose single and averaged sweeps
- Quarantine bad sweeps in reanalysis
- PopSpike Area, Amplitude & Latency
- Three types of Slope measurement
- Analyze all EPSPs in a sweep
- Special analyses of trains Rs measurement from unfiltered trace
- Convert WinLTP data files to ABF files
- Reanalysis of ABF, IBW and WCP files
| Analyze all Evoked Synaptic Responses in a Sweep |
WinLTP is capable of acquiring data from 2
channels and analysing all S0- and S1 evoked synaptic responses in
all acquisition channels (actually up to 1000 S0 and 1000 S1 pulses
in a sweep for each acquisition channel). The analysis of
every pulse in the train is shown for peak amplitude (top figure)
and slope (bottom figure).
Note that to
achieve the best measurement of peak amplitude, the baseline of the
pulse is actually shifted to the right of the pulse (by entering
negative values) to get to the 'lowest' part of the last EPSP
before the next EPSP begins.
Furthermore, even with this careful location of the baseline
of the next pulse, it is never as ‘low’ as it would be if the decay
phase of the EPSP were extrapolated to the peak amplitude time and that value chosen.
In contrast, the slope measurement is much easier and there is no need to consider extrapolation to the baseline of the next pulse as in the case of peak amplitude. The bottom figure shows the second of four trains from the same sweep as the top figure (which shows the first train). The slope analysis graph shows the rapid decrease of slope in the second, third and fourth trains compared to the first train.
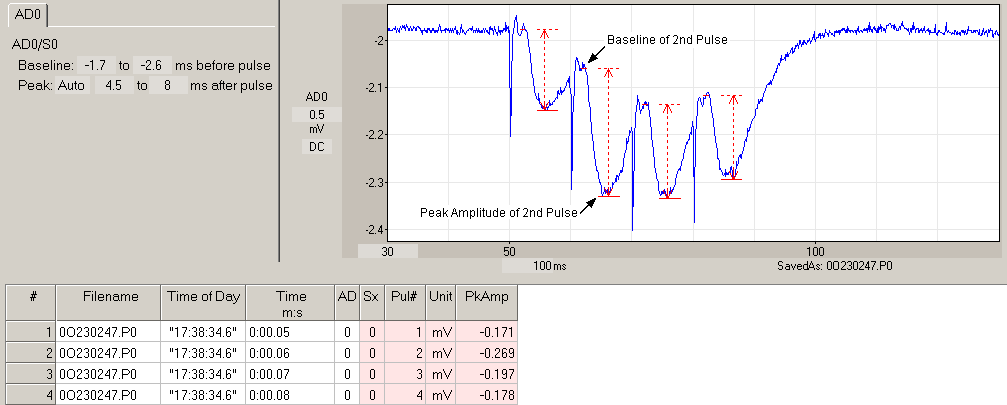 |
| Analysis of the peak amplitude of every pulse in the train. |
| Analysis of the slope of every pulse in the train. This shows the second train of the four train sweep and a dramatic decrease in slope during the train. |