- View sweeps by clicking on an Analysis
Graph data point - Impose single and averaged sweeps
- Quarantine bad sweeps in reanalysis
- PopSpike Area, Amplitude & Latency
- Three types of Slope measurement
- Analyze all EPSPs in a sweep
- Special analyses of trains Rs measurement from unfiltered trace
- Convert WinLTP data files to ABF files
- Reanalysis of ABF, IBW and WCP files
Improved Analysis
In WinLTP 2.10 we improved reanalysis by adding the ability to 1) View single sweeps by clicking on an Analysis Graph data point, 2) Viewing neighboring sweeps, 3) Imposing single and averaged sweeps (for example, to get an average of baseline sweeps), and 4) use the 'Reanalyze Again' button to quickly reanalyze a set of previously chosen sweeps.
In WinLTP 2.20 we further improved reanalysis by adding the ability to 1) StepBack to previous sweeps, 2) Quarantine and Unquarantine single sweeps, 3) Quarantine a Viewed sweep, and 4) Quarantine and Unquarantine single sweeps that make up an averaged sweep.
In WinLTP 2.30, by calling Alen Eapen's bin2txtswps.ese program, we added the capablity of reanalyzing mult-sweep binary Axon ABF files, IgorPro IBW files and WinWCP WCP files. In WinLTP 2.30 we also added analysis of PopSpike Area to PopSpike Amplitude and Latency.
1) Viewing and Imposing Sweeps
View a Sweep by Clicking on an Analysis Graph Data Point
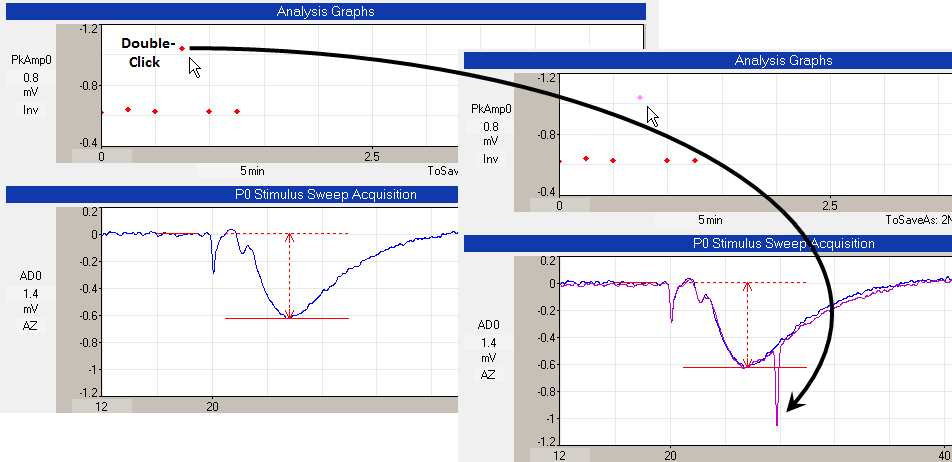 |
| Fig. 7. Viewing a the single sweep by clicking on the outlier data point in an Analysis Graph. When the outlier data point in the PkAmp0 Analysis Graph is double-clicked with the left mouse button, that sweep – showing a large artifact producing the outlier peak amplitude measurement – is superimposed as shown by the magenta colored trace in the lower right hand graph (see black arrow). |
2) View Neighboring Sweeps During Acquisition and Reanalysis
Alternatively, the
currently acquired or reanalyzed sweep can be Viewed by clicking the 'View' button.
Then clicking on the ‘View
Previous Sweep’ or the ‘View Next Sweep’ button will view the
neighboring previous or next sweep so as to move ‘up’ and
‘down’ the list of sweeps (Fig. 8). This makes it easier to search for particular sweeps
of interest. If a
viewed sweep of interest is found, it can then be held on a more
permanent basis by then clicking the 'Impose' button to impose this
sweep on the on-going acquired
or reanalyzed sweep.
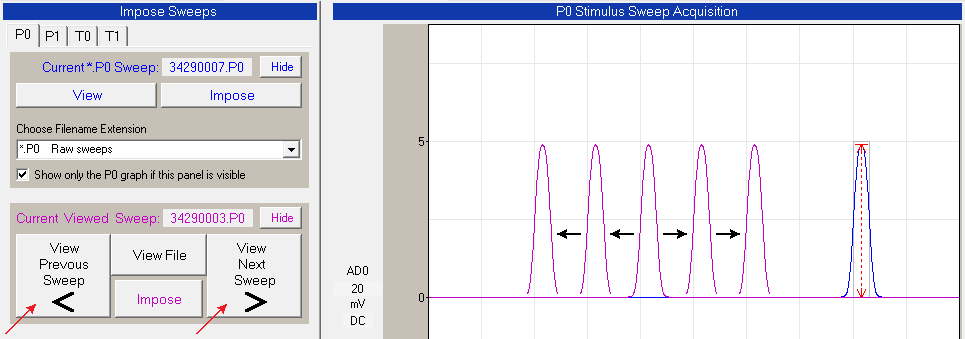 |
| Fig. 8. Shifting ‘up’ and ‘down’ to neighboring Viewed sweeps by clicking on the ‘View Previous Sweep’ and the ‘View Next Sweep’ buttons (shown by red arrows). In this figure, a series of sweeps have been acquired each with a single heavily filtered pulse with 20, 30, 40, 50 and 60 msec pulse delay. |
3) Impose Single and Averaged Sweeps During Acquisition and Reanalysis
If you want to more permanently hold a particular single Current Sweep or Viewed Sweep trace, you can impose this sweep by clicking the ‘Impose’ button under the Current or Viewed Sweep filename field. This imposed sweep will exactly overlay the Current or Viewed Sweep’s trace. The time of day the imposed sweep was acquired, and the sweep’s filename will also be shown in the Imposed ‘Time of Day’ and ‘Filename’ fields (Fig. 9).
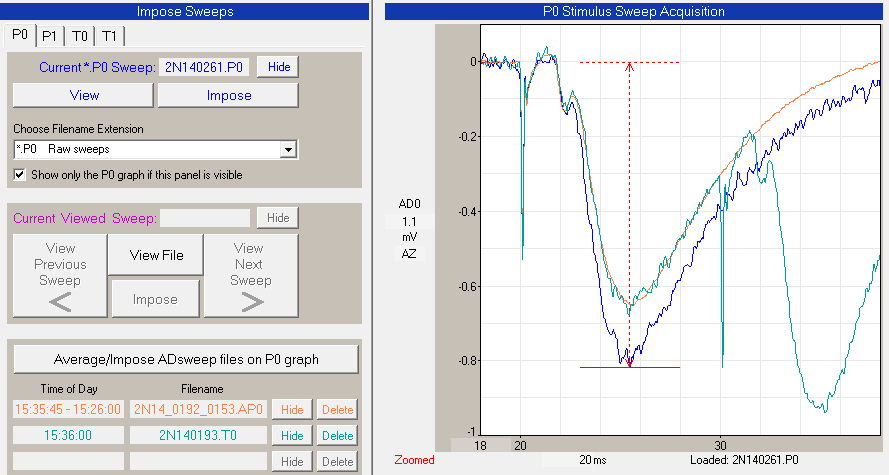 |
| Fig. 9. Imposing single (cyan) and averaged (orange) sweeps during Acquisition or Reanalysis. The orange trace shows the average of 40 baseline sweeps acquired in the 10 min before a LTP theta burst stimulation. The orange ‘Time of Day’ shows the times of the last and first averaged sweeps, and the ‘Filename’ shows the date and number of the last and first averaged sweeps. The single cyan T0sweep trace shows the first two synaptic responses of an LTP inducing theta burst stimulation. The blue trace shows the currently analyzed, last acquired sweep. No sweep is being Viewed. |
In WinLTP Reanalysis programs prior to 2.20, the reanalysis ran forward, essentially re-running, re-living and reanalyzing the experiment but without substantial delays between sweeps. However, if you went too far you had to restart the reanalysis (by clicking the 'Reanalyze Again' button) to go to the earlier sweep you wanted to more carefully inspect. In WinLTP 2.20 we added the StepBack capability. So during a Reanalysis, clicking the 'StepBack' button (Fig. 1B) or pressing the F2 function key caused the reanalysis to step back one sweep.
| After Pausing One Sweep After the Sweep with the Artifact |
 |
| Fig. 1A. After pausing one sweep after the sweep with the artifact. The data point of this last non-artifact sweep (2N140077.P0) and the corresponding spreadsheet line are marked by black arrows. |
| After Stepping Back One Sweep to the Sweep with the Artifact |
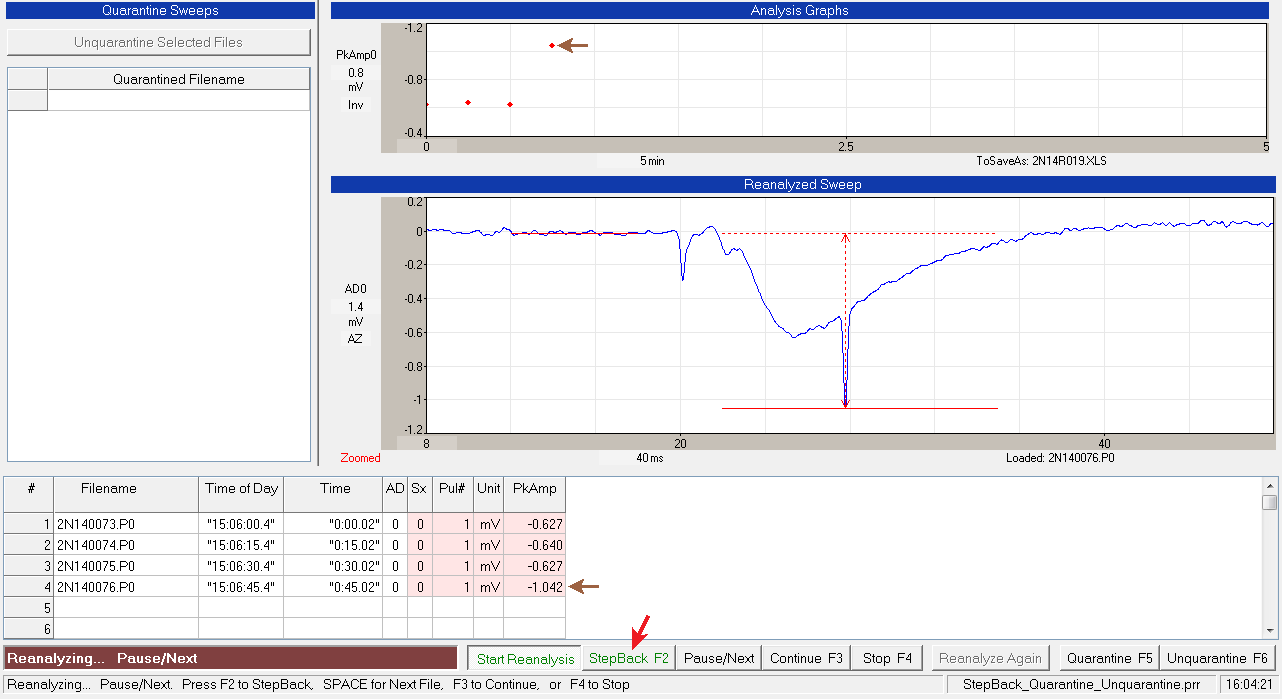 |
| Fig. 1B. Clicking on the 'StepBack F2' button (red arrow) or pressing the F2 key causes the analysis to StepBack one sweep to the sweep containing the artifact (2N140076.P0) that has a substantially larger peak amplitude (see the red amplitude detection line). The last data point in the analysis graph and the last line in the spreadsheet have been removed. The data point and spreadsheet line of the artifact sweep are marked by a brown arrows. |
Using the 'Reanalyze Again' Button to Quickly Reanalyze a Set of Files
In WinLTP 2.10 we have added a 'Reanalyze Again' button
(lower right in Fig. 10) so that you do not have to reselect the
files to reanalyze.
Prior to version 2.10 if you wanted to reanalyze the same set of
files you had to click the ‘Start Reanalyze’ button and then
reselect the files you wished to reanalyze from the ‘Select Files to
Reanalyze…’ dialog box.
Now you just click the ‘Reanalyze Again’ button and it is as if you
reselected all those files.
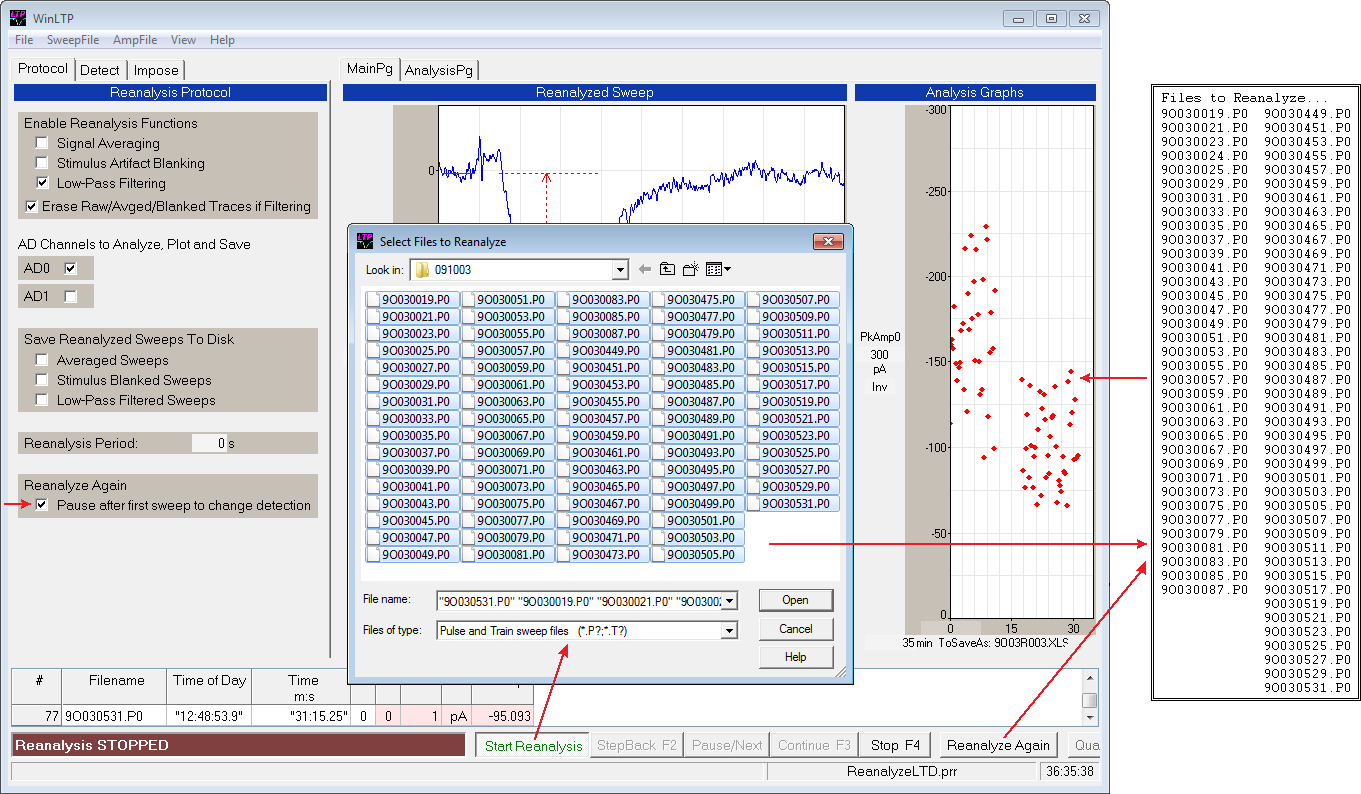 |
| Fig. 10. Rapid reanalysis using the ‘Reanalyze Again’ button. Clicking the ‘Start Reanalysis button calls the ‘Select Files to Reanalyze’ dialog box (lower left arrow). When a set of files is selected, they are then loaded into a Files to Reanalyze list (middle right arrow) which then determines which files are then reanalysed (upper right arrow). However, once the ‘Select Riles to Reanalyze’ dialog box has set the Files to Reanalyze list, clicking the ‘Reanalyze Again’ button can then re-reanalyze the same files in the ‘Files to Reanalyze list (lower right arrow). The left arrow points to the ‘Pause after first sweep to change detection’ check box. |
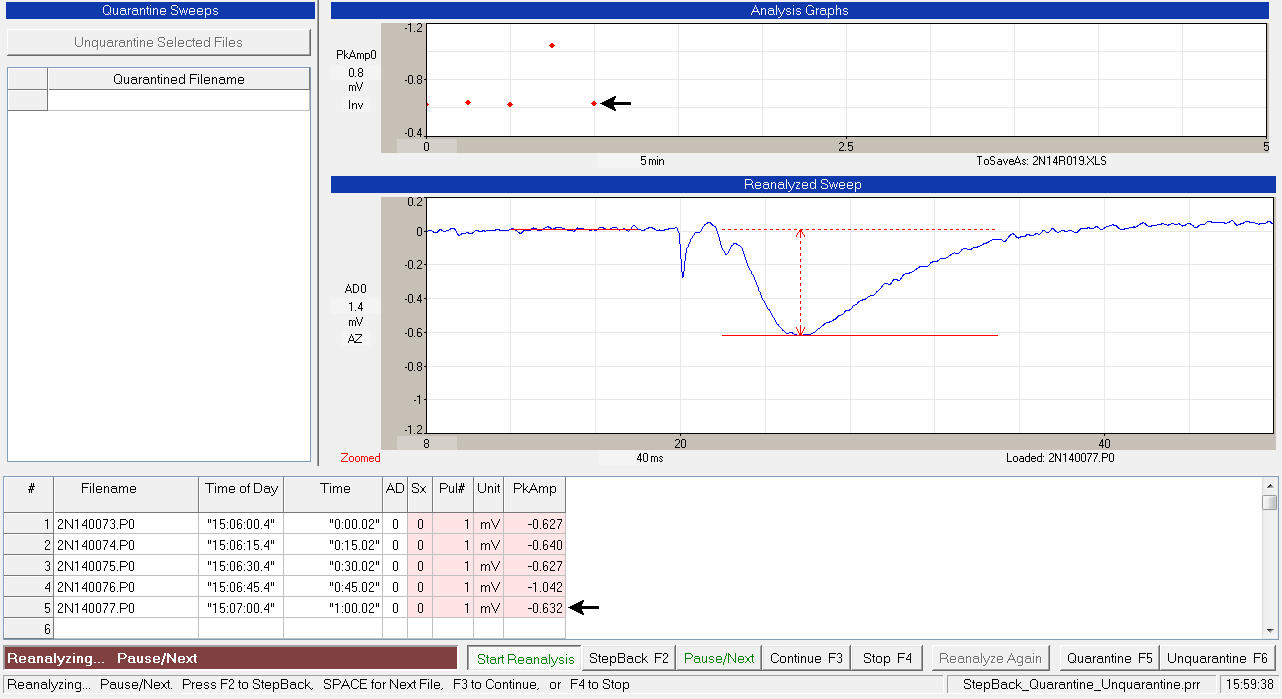
6) Quarantine Bad Sweep Files in Reanalysis
Quarantine and Unquarantine Single, Non-Averaged Sweeps
WinLTP 2.20 has added the capability to quarantine single, non-averaged sweeps. Just click the 'Quarantine F5' button or press the F5 key to quarantine the current sweep (Fig. 2A). The data point in the analysis graph is removed, the values in the spreadsheet line are changed to " ", and the quarantined filename appears in the Quarantined Filename spreadsheet.
Clicking the 'Unquarantine F6' button or pressing the F6 key unquarantines the current file, removes the filename from the Quarantined Filename spreadsheet, and reanalyzes the file (Fig. 2B).
| After Quarantining the Sweep with the Artifact |
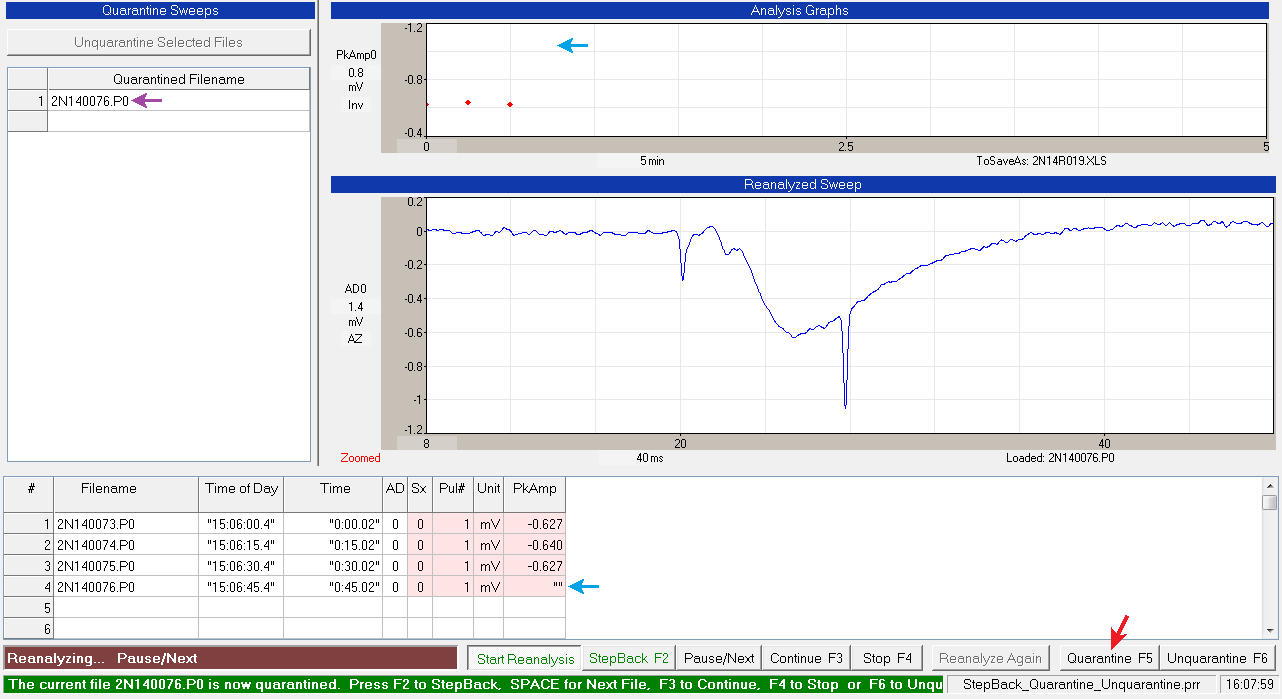 |
| Fig. 2A. Clicking the 'Quarantine F5' button (red arrow) or pressing the F5 key causes the current sweep (the artifact sweep also shown in Fig 1B, 2N140076.P0) to be quarantined. The last data point in the analysis graph has been removed, and the peak amplitude value last line in the spreadsheet (corresponding to the sweep with the artifact) has been changed to " " (blue arrows). Also, the artifact sweep no longer has the red peak amplitude detection lines (because it no longer is being analyzed). And the quarantined filename, 2N140076.P0, now appears in the Quarantined Filename spreadsheet (purple arrow). |
| After Unquarantining the Sweep with the Artifact |
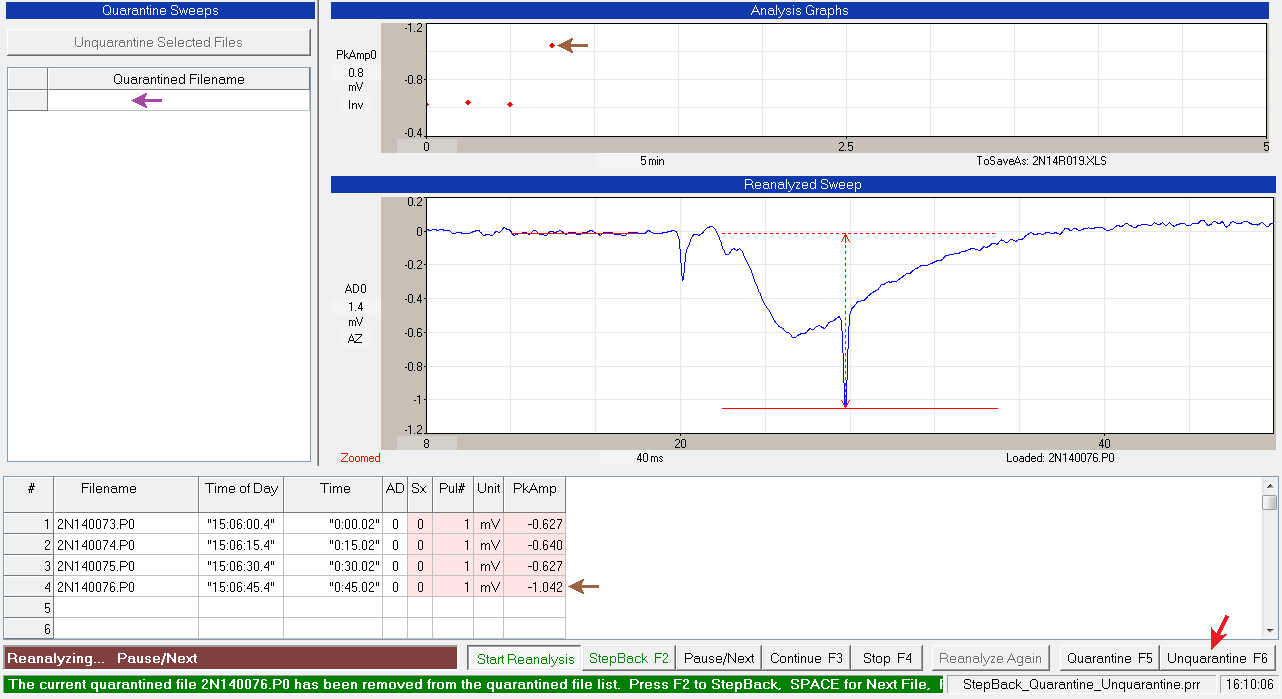 |
| Fig. 2B. Clicking the 'Unquarantine F6' button (red arrow) or pressing the F6 key unquarantines the current file (2N140076.P0), removes the filename from the Quarantined Filename spreadsheet (purple arrow), and reanalyzes the file and adding the 2N140076.P0 line to the spreadsheet and the data point to the analysis graph (brown arrows). |
7) Quarantine and Unquarantine a Single Sweep that Makes Up an Averaged Sweep
WinLTP 2.20 has also added the capability to quarantine a single sweeps that makes up part of an averaged sweep. Just click the 'Quarantine F5' button or press the F5 key to quarantine the current sweep (Fig. 3B). The spreadsheet line and the data point in the analysis graph for the averaged sweep are recalculated, and the quarantined single sweep filename appears in the Quarantined Filename spreadsheet.
Clicking the 'Unquarantine F6' button or pressing the F6 key unquarantines the current file, removes the filename from the Quarantined Filename spreadsheet, and reanalyzes averaged sweep (not shown).
| Before Quarantining a Single Sweep with an Artifact that Makes Up an Averaged Sweep |
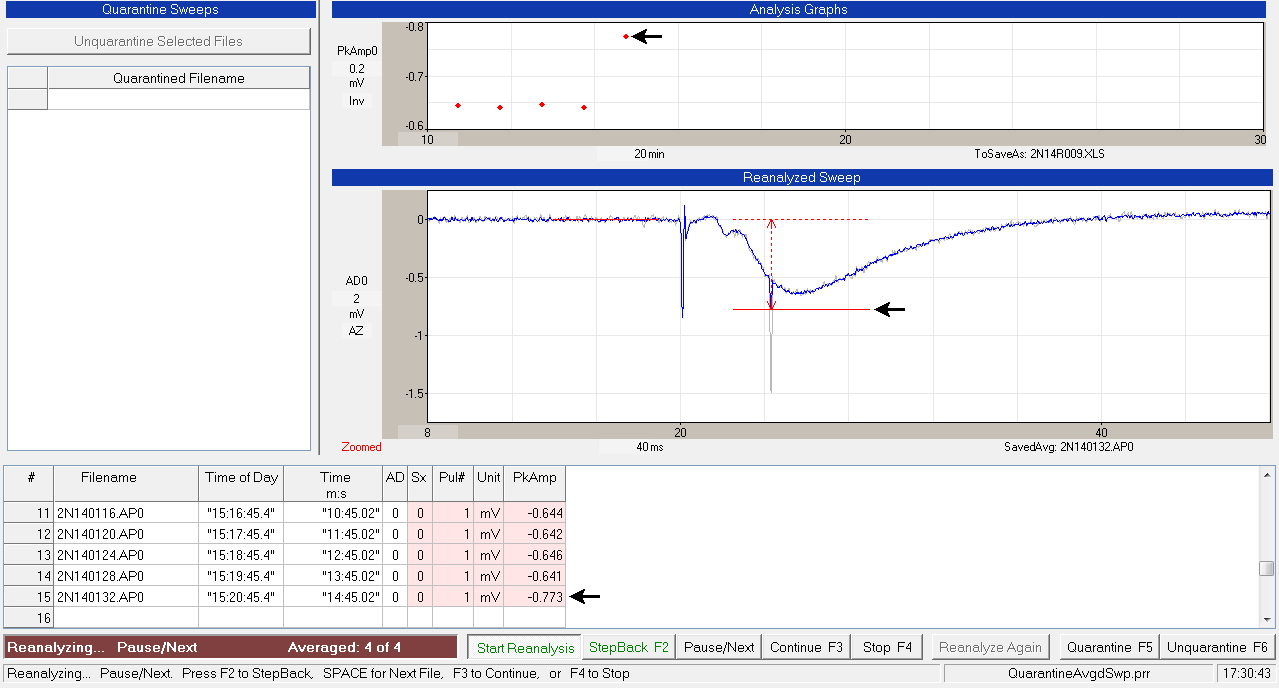 |
| Fig. 3A. Before quarantining a single sweep with an artifact that makes up part of an averaged sweep (2N140132.AP0). This averaged sweep file is the average of 4 single sweeps. The last of these single sweeps (shown above in gray) has a 1.0 mV artifact. Since the averaged it is an average of 4 sweeps, 3 of which have no artifacts, the artifact in the averaged sweep is about 0.25 mV. This produces an artifactually high peak amplitude of -0.773 mV (black arrows) rather than the peak amplitudes of about -0.645 mV in the previous averaged sweep files. |
| After Quarantining a Single Sweep that Makes Up an Averaged Sweep |
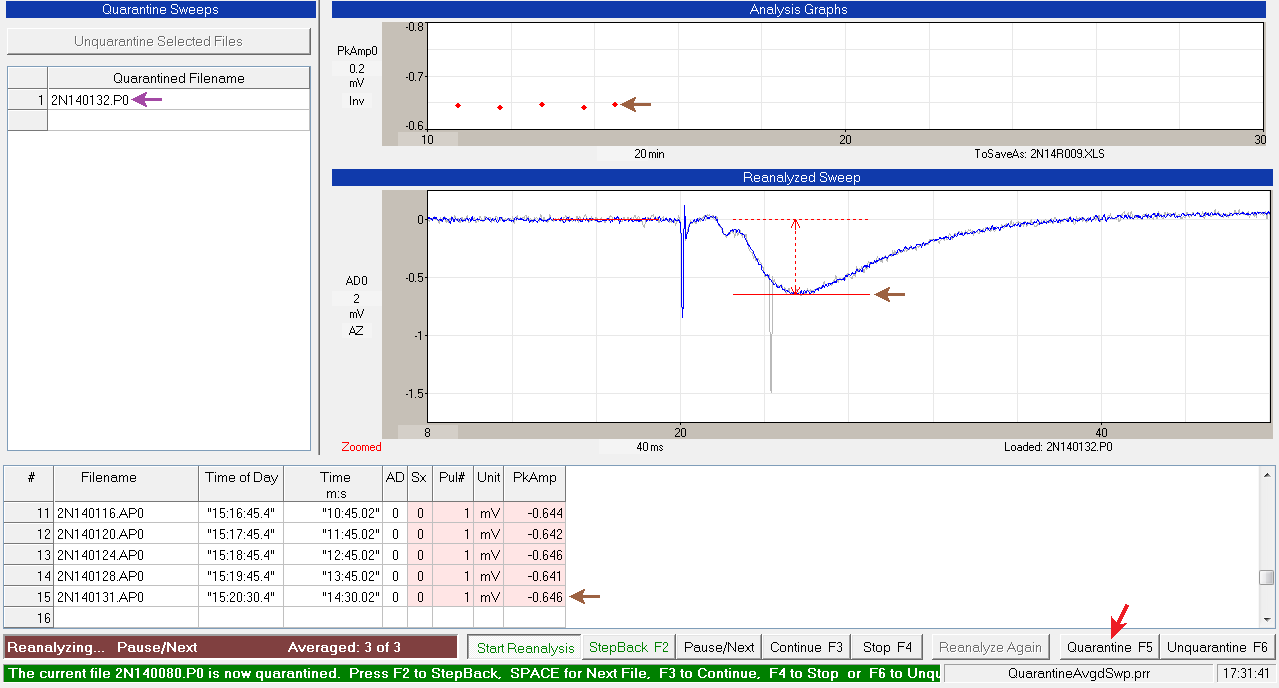 |
| Fig. 3B. Clicking the 'Quarantine F5' button (red arrow) or pressing the F5 key quarantines the current last sweep with an artifact, reaverages the first 3 sweeps to make a new averaged sweep file (2N140132,AP0), and recalculates the peak amplitude of the averaged first 3 sweeps. The red peak amplitude detection line now rides on top of the fEPSP peak, the averaged sweep spreadsheet line, and data point in the analysis graph now show a peak amplitude of -0.646 mV (brown arrows) rather than the pre-quarantine value of -0.773 mV (Fig 3A) and are now similar to the peak amplitudes of the previous averaged sweep files. |
8) Quarantine a Viewed Single Sweep
In WinLTP 2.10 we added the capability of clicking on an (outlier) Analysis Graph data point to view that sweep. In WinLTP 2.20 we have added the capability of quarantining that View Sweep, removing that data point from the Analysis Graph, and removing the values in the Spreadsheet by setting the values to "".
This only works when you are NOT signal averaging. If you are signal averaging, you have to reanalyze the sweeps comprising the averaged sweep, and only quarantine the sweep(s) that have the artifact(s).
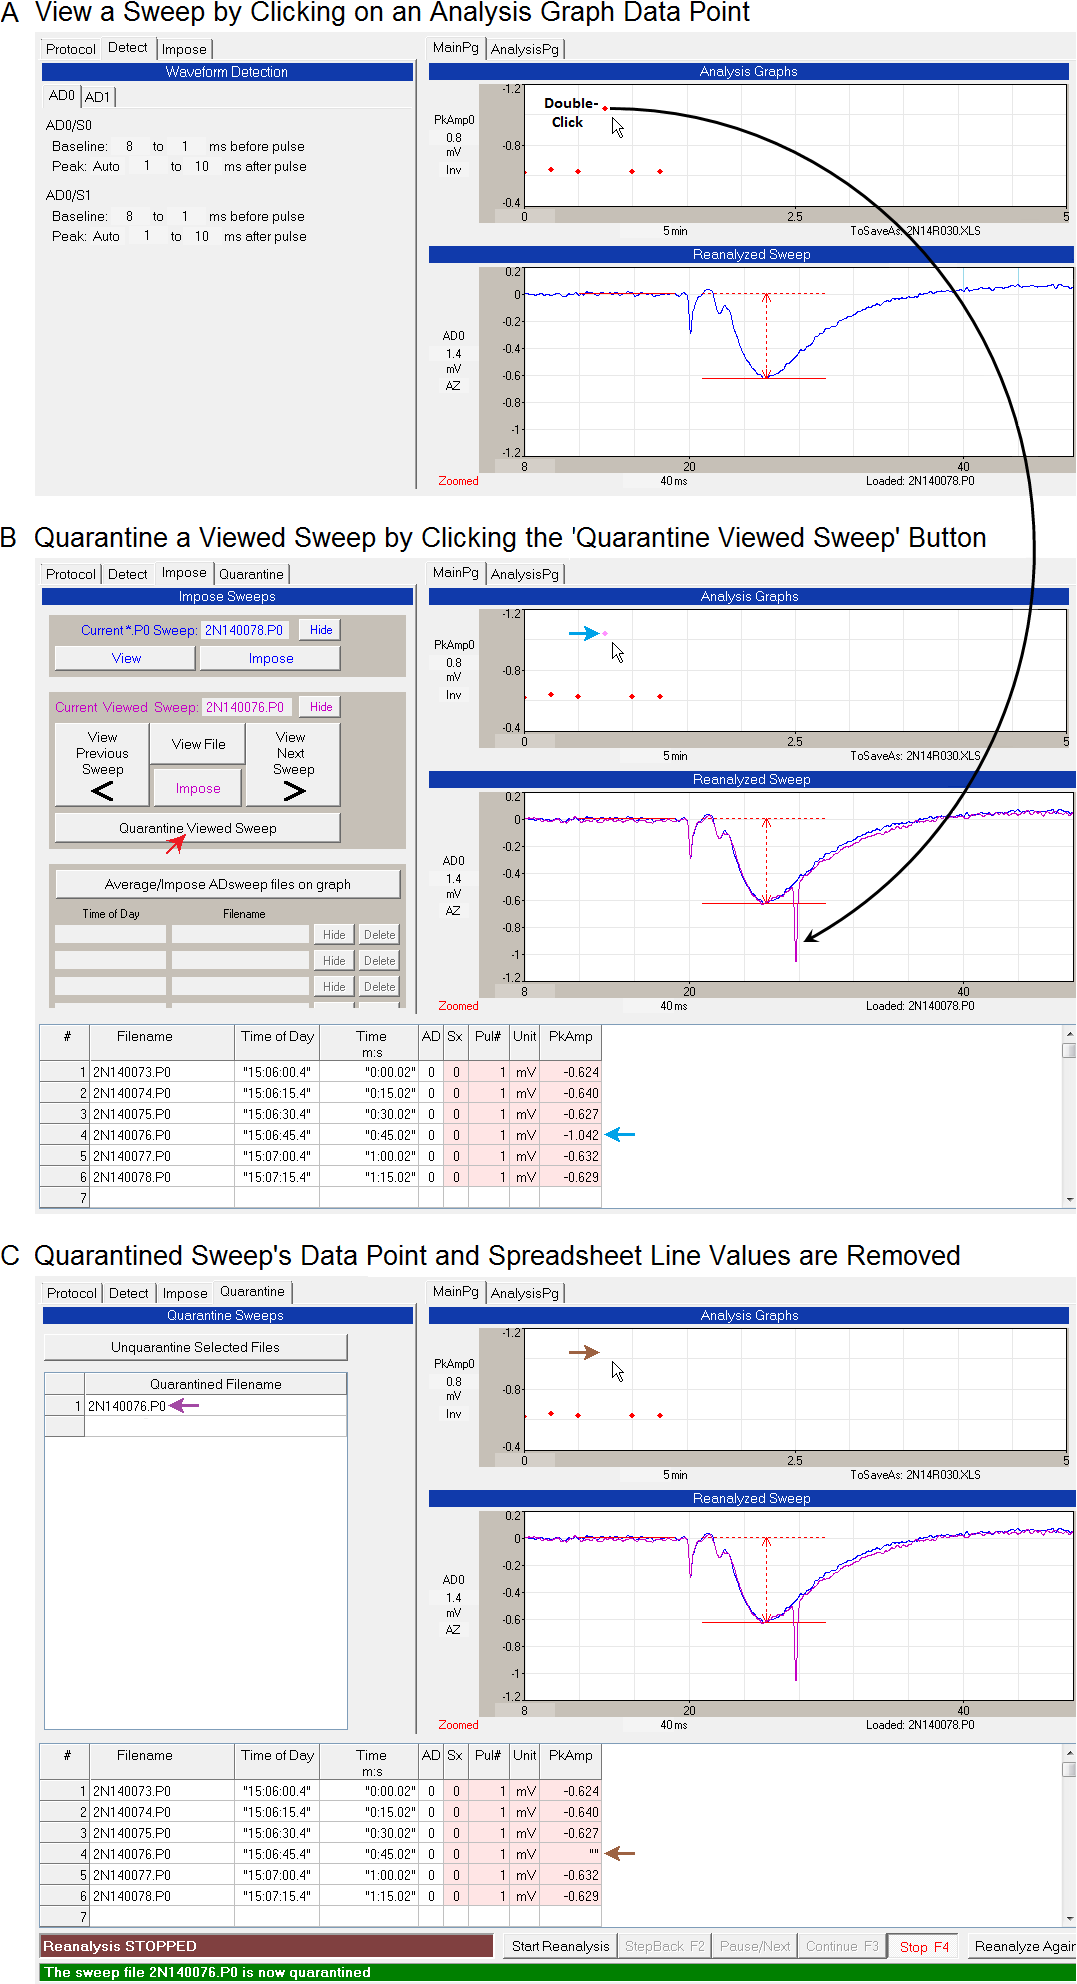 |
| Fig. 4. A and B) Double-clicking on an outlier Analysis Graph data point causes that sweep (2N140076.P0) to be viewed (the magenta sweep with the large artifact, black arrow). B and C) Then clicking on the 'Quarantine Viewed Sweep' button (red arrow in B) causes that View Sweep to be quarantined. Its data point in the Analysis Graph is removed, and the PkAmp value in the Spreadsheet was removed by setting the value to "" (brown arrows in C). Finally the viewed sweep filename is placed in the Quarantined Filename list (purple arrow in C) so that this file will not be included in a reanalysis. |
9) Save and Reload a List of Quarantined Sweep Files
If you wish to continue reanalyzing this experiment at a later time, you can save the list of the quarantined sweep files by clicking on the menu item:
AmpFile -> Save Quarantined Filename List
(top red arrow in Fig. 5). This quarantined list file will be automatically named. And at a later time you can recall this list of quarantined files by clicking on the menu item:
AmpFile -> Add files from a Quarantined Filename List file
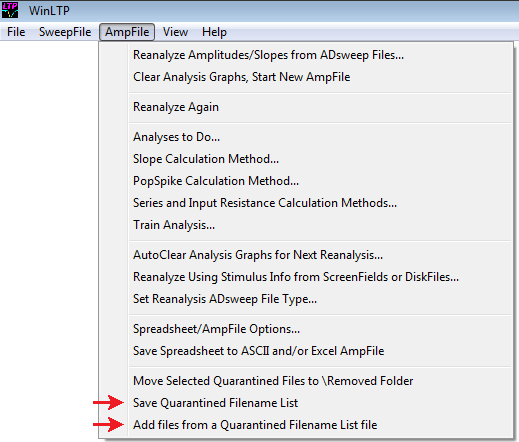 |
| Fig. 5. Saving a list of quarantined filenames, and retrieving that list at a later time. |
10) Move Selected Quarantined Files from the \DataFolder to the \Removed Folder
If you wish, you can remove the quarantined files from the current \DataFolder and move them to a '\Removed' folder. To do this, first select the files you want to move to the \Removed folder by clicking (or Ctrl-clicking) on the files in the Quarantined Filename list you wish to move (only 2N140076.P0 in Fig. 6). Then click the menu item:
AmpFile -> Move Selected Quarantined Files to the \Removed Folder
and the selected files will be moved to the \Removed folder (that will be created if necessary) as a subfolder under the current \DataFolder
Note that if you remove the files from reanalysis this way, then the line of those \Removed quarantined files took up in the main Spreadsheet will not be there, and this may make it more difficult to average data points across experiments if this is done. So use 'Move Selected Quarantined Files to the \Removed Folder' with care.
If you wish to move back files from the \Removed folder back to the current \DataFolder, you can use the Windows Explorder program.
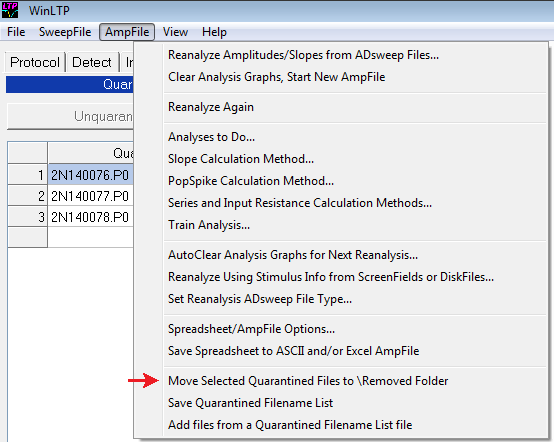 |
| Fig. 6. Move files from the Quarantined Filename list by selecting them first (2N140076.P0 is the only filename above selected), then click on the menu item AmpFile -> Move Selected Quarantined files to \Removed folder (red arrow). |